How to Apply Richard D. Wyckoff’s Distribution Phase
Uncover the intricacies of stock market analysis with a guide on how to apply Richard D. Wyckoff’s Distribution Phase for informed investing strategies.
How to Apply Richard D. Wyckoff’s Accumulation Phase

Ever wondered why some traders know when to buy, while others don’t? The Wyckoff Accumulation Phase could be the answer. Richard D. Wyckoff, a stock market legend since the early 1900s, shared key insights. By watching market trends and acting like big investors, you can find great trading chances and improve your game. In this article, I’ll show you how to use the Richard D. Wyckoff strategy, especially the Accumulation Phase. Get ready to boost your trading skills! Key Takeaways Understanding Richard D. Wyckoff’s principles enhances trading decisions. The Accumulation Phase is vital for identifying buying opportunities. Observing supply and demand can reveal institutional investor behaviour. Price action and volume analysis are crucial in recognising accumulation. Avoid common mistakes to optimise your accumulation strategy. Understanding the Wyckoff Method As I explore trading, I often think about Richard D. Wyckoff’s insights. His principles have changed how I see market behaviour. The Wyckoff Method shows the complex relationship between supply and demand in trading. The Origins of Richard D. Wyckoff’s Principles Richard D. Wyckoff was a key figure in technical analysis in the 1930s. His work on market structure and behaviour is still important today. His ideas help me improve my trading strategies by understanding buyer and seller actions. Key Concepts of the Wyckoff Method The Wyckoff Method focuses on several key ideas. It talks about the market cycle, which has four phases: accumulation, markup, distribution, and markdown. These phases help me see the market’s natural flow. This understanding is key for making smart trading decisions and increasing profits. Importance of Supply and Demand Supply and demand are at the core of the Wyckoff Method. They help me understand price changes. By watching how these forces work, I can make better trading choices. This skill is vital, especially when using the 5-0 trading pattern. What is the Accumulation Phase? The Accumulation Phase is key to grasping market movements in the Wyckoff Method. It’s when big investors buy a lot, getting ready for prices to go up. Knowing how to spot this phase can really help traders do better. Identifying the Accumulation Phase To find the Accumulation Phase, I look for a few important signs. First, if prices stay the same within a certain range, it means buyers are getting stronger. Seeing higher lows is another clue, showing demand is beating supply. Also, when volume goes up and prices stay stable, it’s a sign of big investors’ interest. Role of Institutional Investors in Accumulation Institutional investors are very important in the Accumulation Phase. They slowly build up big positions without making prices jump too much. This helps them get in before prices rise. Watching their moves is crucial for predicting future trends. Characteristics of Accumulation Patterns The Wyckoff Accumulation Patterns have some clear signs. They take weeks or months to form, leading to a calm period where prices don’t move much. The main features are: Range-bound trading: Prices swing in a set range. Increased volume: Volume goes up as the phase grows. Higher lows: Each low is higher than the last, showing buyers are winning. Understanding these traits helps me spot the Accumulation Phase and make smarter trading choices. How to Apply Richard D. Wyckoff’s Accumulation Phase To apply Wyckoff’s Accumulation Phase, I follow several steps. These steps help me find good investment opportunities. I will explain how to do this using Price Action Analysis and Wyckoff Entry Signals. Steps to Identify Accumulation Phases I start by looking at historical price charts for accumulation phases. I look for patterns that show a lot of buying. This helps me find where the market might turn. Utilising Price Action and Volume Analysis Price Action Analysis is key for me. I watch how prices move and compare this with volume. When volume goes up with price, it’s a sign of accumulation. This helps me understand the market better. Key Signals for Entry Points Finding Wyckoff Entry Signals is crucial for me. These signals often come after a period of calm. A bullish reversal pattern makes me more confident in my trades. They guide me on when to enter the market. Establishing Stop-Loss Levels Setting stop-loss levels is important for managing risk. I choose these levels carefully to protect my investment. It’s essential to check these levels often to keep my investment safe. Step Description Importance 1 Identify Accumulation Phases Recognising price patterns can indicate future movements. 2 Utilise Price Action Analysis Combining price with volume analysis reveals market interest. 3 Spot Wyckoff Entry Signals Key signals help determine successful entry points. 4 Establish Stop-Loss Levels Prevent severe losses by protecting investments with logical levels. Wyckoff Accumulation Techniques for Traders To improve my trading, I use Wyckoff Accumulation Techniques. These help me understand the accumulation phase better. Point and Figure Charting is especially useful for tracking price changes. Point and Figure Charting Point and Figure Charting cuts through market noise, giving me a clear view. It shows important price levels and trends clearly. I can spot when prices might jump up next. Using Trendlines and Support/Resistance Levels Setting up trendlines helps me see price changes over time. Drawing these lines and finding key support and resistance levels helps me plan better. It lets me predict when prices might change direction or keep going. Recognising Market Cycles with Wyckoff Methods Knowing about Market Cycles in Trading is key to success. It helps me match my strategies with the market’s mood. This way, I can make the most of the accumulation phase and increase my profits. Common Mistakes to Avoid During Accumulation Understanding the Accumulation Phase is key to avoiding common pitfalls. Recognising these mistakes helps me improve my strategy and increase profits. A disciplined approach is crucial to avoid financial losses. Misinterpretation of Market Signals Misreading trading signals is a big risk in the accumulation phase. Price changes and volume spikes can be misleading. It’s important to rely on solid analysis and proven strategies to avoid mistakes. Overtrading During Accumulation Phase Overtrading can harm your gains by
Navigating The AB=CD Trading Pattern
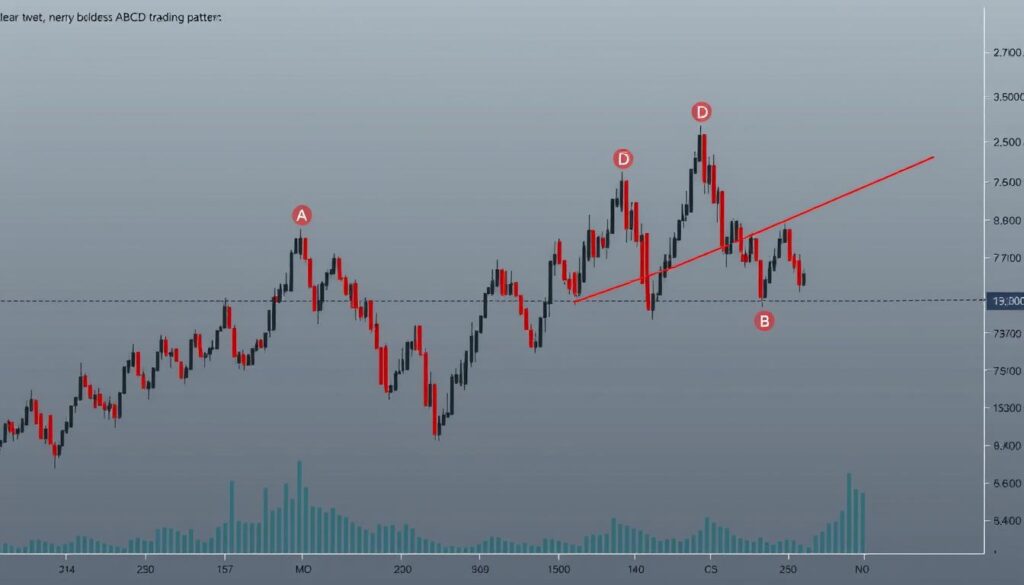
Explore the fundamentals of the AB=CD Trading Pattern with insight into its role in Forex and harmonic technical analysis.
Unleashing the Power of Adaptive Fibonacci Levels
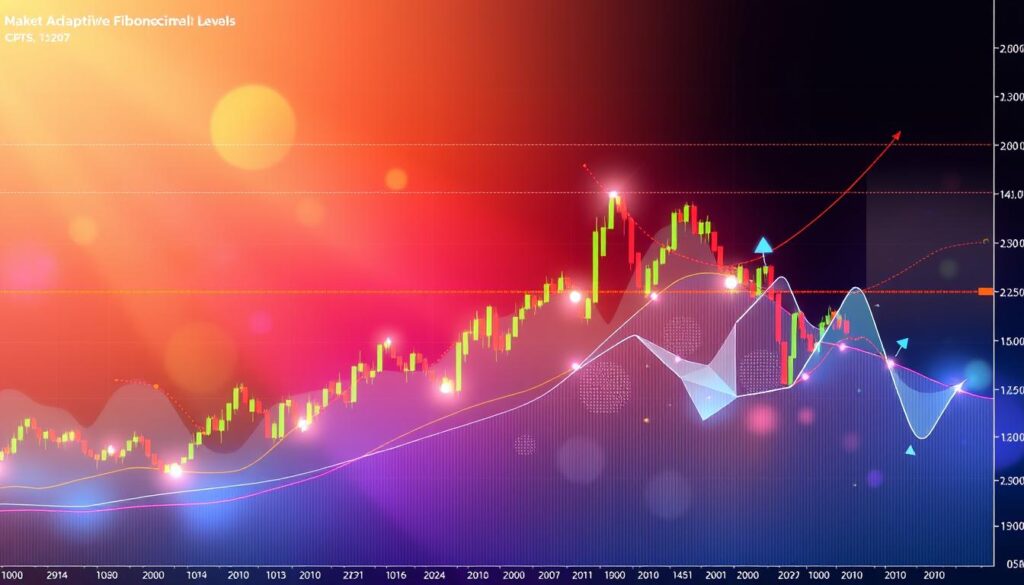
Discover the dynamic world of Adaptive Fibonacci Levels and elevate your trading strategies with cutting-edge analysis insights.
Decoding 15-Minute Charts with 5-0 Trading Pattern For Intraday Stock Traders
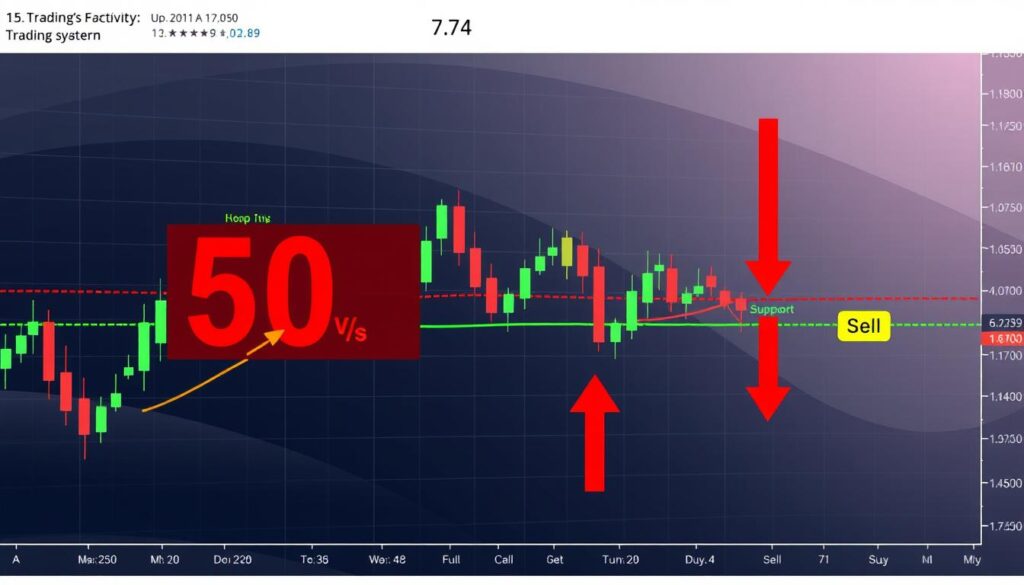
In the fast world of day trading, knowing 15-minute charts is key. They help traders like me spot short-term trends. This lets us make quick and smart decisions about when to buy or sell. The 5-0 Trading Pattern For Intraday Stock Traders is a clever strategy. It makes the stock market’s complex world easier to understand. By studying these patterns, I can improve my trading plans and do better overall. Since about 60% of currency trades happen through bank talks, good chart analysis is very important. It can really change how well a trade does. Using 15-minute charts helps me understand the stock market better. It also helps me stay ready for the market’s ups and downs. In the next parts, I’ll dive into the 5-0 trading pattern’s main points and how it helps me in trading. Key Takeaways 15-minute charts provide a clear view of short-term market movements. The 5-0 trading pattern helps in identifying key trading opportunities. Effective chart analysis is essential for developing successful intraday trading strategies. Understanding market volatility aids in making timely trading decisions. Automated trading systems play a significant role in enhancing trading efficiency. Introduction to 15-Minute Charts As an intraday trader, I find 15-Minute Charts very useful. They give a detailed look at price changes during the day. This helps me quickly respond to market changes. These charts are great for spotting short-term trends. They help me make better trading plans. By looking at shorter periods, I can find the best times to buy or sell. 15-Minute Charts show important price levels. Patterns like the head and shoulders can help predict market changes. Using these patterns with Technical Analysis Tools helps me make smarter trades. These charts also show trading volume trends. This is key to understanding market liquidity. It helps me find the best trading chances. Combining 15-Minute Charts with good trading strategies has changed my approach. It has improved my trading results. The Importance of Chart Analysis in Intraday Trading Chart analysis is key for intraday trading success. It gives traders the insights needed to understand the stock market. By using different analytical methods, I can spot trading chances effectively. Patterns like triangles and flags often show where the market is going. But, these patterns lose their power when everyone knows them. False breakouts, especially with head-and-shoulders patterns, can mislead traders. Knowing this helps me avoid these traps. Using charts like the Gartley pattern and Fibonacci adds depth to my analysis. This helps me understand when trends might change or continue. For example, the crown pattern helps me spot market turns, making my trading decisions more reliable. The Fibonacci series is great for making price predictions. It helps me plan my market moves better. Adding volume analysis to my chart study makes my findings more solid. It shows me if a pattern is real or not. Learning from common mistakes makes my trading smarter. I avoid overlooking the big picture or ignoring volume. Good risk management is crucial when using different chart patterns. It helps me limit losses and grab good opportunities. Chart Pattern Type Characteristics Usage in Trading Head-and-Shoulders Reversal Signifies a trend reversal; subject to false breakouts Used to predict downward movements Gartley Harmonic Fibonacci relationships applied to price swings Identifies potential price retracement levels Crown Reversal Utilises Fibonacci to identify turning points Enhances odds of successfully trading Fibonacci Extensions Predictive Ratios used for anticipating price targets Guides strategic trading decisions Understanding Market Volatility Market volatility is how fast the price of things like stocks goes up or down. It’s key for those who trade during the day. Things like economic news and market trends can cause these changes. Good stock trading tips say to watch money flow. If money flow is up, prices might go up too. But if it’s down, prices could fall. For example, Day One saw a lot of money flow, but Day Two didn’t. How volatile the market is affects trading. Tools like the Chaikin money flow oscillator help. They show when things are overbought or oversold. This helps traders know what to do next. Harmonic patterns, like those by M. Gartley, help traders. They use Fibonacci numbers to make smart choices. These patterns are useful for dealing with market ups and downs. But, harmonic patterns can be tricky to learn. Traders need to be patient. Yet, they can offer valuable insights. Some even use computers to find these patterns, making trading easier. Decoding the 5-0 Trading Pattern For Intraday Stock Traders The 5-0 Trading Pattern is a key tool for spotting high-probability trades. It captures market movements and fits well with my intraday trading strategies. Knowing this pattern is essential for making timely decisions that boost trading success. Overview of the 5-0 Trading Pattern The 5-0 Trading Pattern is known for its clear structure, appearing after big price moves. It has five key price points that show potential reversals. This helps traders predict future price actions and make better decisions. Intraday traders use this pattern to find opportunities in market volatility. Key Characteristics of the 5-0 Trading Pattern The 5-0 Trading Pattern has unique features that make it valuable. These include: Price Point Identification: The pattern has specific levels for potential reversals, marking entry and exit points. Volume Analysis: Watching volume during the pattern’s formation helps confirm trades, showing market sentiment. Timeframe Flexibility: While used in 15-minute charts, its principles work across different timeframes for detailed analysis. Market Context: Knowing the broader market helps validate the 5-0 pattern, guiding my trading strategies. Studies on liquidity support the 5-0 Trading Pattern’s reliability. This gives me confidence in navigating intraday trading’s complexities. Characteristic Description Structure Consists of five distinct price points indicating potential reversals. Volume High volume at specific points offers confirmation of market moves. Timeframe Effective in 15-minute charts but applicable across different timeframes. Market Context Understanding overall market conditions is crucial for accurate analysis. Technical Analysis Tools for Day Traders As a day trader, I find Technical Analysis Tools crucial for making
