How to Apply Richard D. Wyckoff’s Distribution Phase
Uncover the intricacies of stock market analysis with a guide on how to apply Richard D. Wyckoff’s Distribution Phase for informed investing strategies.
How to Apply Richard D. Wyckoff’s Accumulation Phase
Ever wondered why some traders know when to buy, while others don’t? The Wyckoff Accumulation Phase could be the answer. Richard D. Wyckoff, a stock market legend since the early 1900s, shared key insights. By watching market trends and acting like big investors, you can find great trading chances and improve your game. In this article, I’ll show you how to use the Richard D. Wyckoff strategy, especially the Accumulation Phase. Get ready to boost your trading skills! Key Takeaways Understanding Richard D. Wyckoff’s principles enhances trading decisions. The Accumulation Phase is vital for identifying buying opportunities. Observing supply and demand can reveal institutional investor behaviour. Price action and volume analysis are crucial in recognising accumulation. Avoid common mistakes to optimise your accumulation strategy. Understanding the Wyckoff Method As I explore trading, I often think about Richard D. Wyckoff’s insights. His principles have changed how I see market behaviour. The Wyckoff Method shows the complex relationship between supply and demand in trading. The Origins of Richard D. Wyckoff’s Principles Richard D. Wyckoff was a key figure in technical analysis in the 1930s. His work on market structure and behaviour is still important today. His ideas help me improve my trading strategies by understanding buyer and seller actions. Key Concepts of the Wyckoff Method The Wyckoff Method focuses on several key ideas. It talks about the market cycle, which has four phases: accumulation, markup, distribution, and markdown. These phases help me see the market’s natural flow. This understanding is key for making smart trading decisions and increasing profits. Importance of Supply and Demand Supply and demand are at the core of the Wyckoff Method. They help me understand price changes. By watching how these forces work, I can make better trading choices. This skill is vital, especially when using the 5-0 trading pattern. What is the Accumulation Phase? The Accumulation Phase is key to grasping market movements in the Wyckoff Method. It’s when big investors buy a lot, getting ready for prices to go up. Knowing how to spot this phase can really help traders do better. Identifying the Accumulation Phase To find the Accumulation Phase, I look for a few important signs. First, if prices stay the same within a certain range, it means buyers are getting stronger. Seeing higher lows is another clue, showing demand is beating supply. Also, when volume goes up and prices stay stable, it’s a sign of big investors’ interest. Role of Institutional Investors in Accumulation Institutional investors are very important in the Accumulation Phase. They slowly build up big positions without making prices jump too much. This helps them get in before prices rise. Watching their moves is crucial for predicting future trends. Characteristics of Accumulation Patterns The Wyckoff Accumulation Patterns have some clear signs. They take weeks or months to form, leading to a calm period where prices don’t move much. The main features are: Range-bound trading: Prices swing in a set range. Increased volume: Volume goes up as the phase grows. Higher lows: Each low is higher than the last, showing buyers are winning. Understanding these traits helps me spot the Accumulation Phase and make smarter trading choices. How to Apply Richard D. Wyckoff’s Accumulation Phase To apply Wyckoff’s Accumulation Phase, I follow several steps. These steps help me find good investment opportunities. I will explain how to do this using Price Action Analysis and Wyckoff Entry Signals. Steps to Identify Accumulation Phases I start by looking at historical price charts for accumulation phases. I look for patterns that show a lot of buying. This helps me find where the market might turn. Utilising Price Action and Volume Analysis Price Action Analysis is key for me. I watch how prices move and compare this with volume. When volume goes up with price, it’s a sign of accumulation. This helps me understand the market better. Key Signals for Entry Points Finding Wyckoff Entry Signals is crucial for me. These signals often come after a period of calm. A bullish reversal pattern makes me more confident in my trades. They guide me on when to enter the market. Establishing Stop-Loss Levels Setting stop-loss levels is important for managing risk. I choose these levels carefully to protect my investment. It’s essential to check these levels often to keep my investment safe. Step Description Importance 1 Identify Accumulation Phases Recognising price patterns can indicate future movements. 2 Utilise Price Action Analysis Combining price with volume analysis reveals market interest. 3 Spot Wyckoff Entry Signals Key signals help determine successful entry points. 4 Establish Stop-Loss Levels Prevent severe losses by protecting investments with logical levels. Wyckoff Accumulation Techniques for Traders To improve my trading, I use Wyckoff Accumulation Techniques. These help me understand the accumulation phase better. Point and Figure Charting is especially useful for tracking price changes. Point and Figure Charting Point and Figure Charting cuts through market noise, giving me a clear view. It shows important price levels and trends clearly. I can spot when prices might jump up next. Using Trendlines and Support/Resistance Levels Setting up trendlines helps me see price changes over time. Drawing these lines and finding key support and resistance levels helps me plan better. It lets me predict when prices might change direction or keep going. Recognising Market Cycles with Wyckoff Methods Knowing about Market Cycles in Trading is key to success. It helps me match my strategies with the market’s mood. This way, I can make the most of the accumulation phase and increase my profits. Common Mistakes to Avoid During Accumulation Understanding the Accumulation Phase is key to avoiding common pitfalls. Recognising these mistakes helps me improve my strategy and increase profits. A disciplined approach is crucial to avoid financial losses. Misinterpretation of Market Signals Misreading trading signals is a big risk in the accumulation phase. Price changes and volume spikes can be misleading. It’s important to rely on solid analysis and proven strategies to avoid mistakes. Overtrading During Accumulation Phase Overtrading can harm your gains by
Unleashing the Power of Adaptive Fibonacci Levels
Discover the dynamic world of Adaptive Fibonacci Levels and elevate your trading strategies with cutting-edge analysis insights.
Capturing Explosive Accumulation Distribution Movements in Forex Trading
In the fast-paced world of forex trading, grasping the subtleties of accumulation and distribution movements can be transformative. For those looking to leverage explosive market shifts, understanding these concepts is essential. These phases signal major shifts in market dynamics, presenting chances for strategic positioning and significant profits. Exploring the mechanics behind these movements is my goal. I aim to arm you with the necessary knowledge to navigate the volatile forex market. Whether you’re new to trading or have years of experience, grasping these phases can greatly improve your strategy. It enables you to identify the best times to enter and exit the market with accuracy. Key Takeaways Accumulation and distribution are critical phases in forex trading. Understanding these movements helps in recognising explosive market shifts. Mastery of these concepts can enhance your trading strategy. These phases provide insights into forex market trends. Knowledge of accumulation and distribution aids in precise market positioning. Understanding Accumulation Distribution in Forex Trading To effectively navigate the forex market, it’s crucial to grasp the essence of the accumulation distribution indicator. This powerful tool helps me decode the underlying market dynamics. It enables me to make informed trading decisions, enhancing my strategic trading approach. What is Accumulation Distribution? The accumulation distribution indicator is a volume-based metric that identifies the relationship between an asset’s price and its volume flow. By analysing these factors, I can discern whether a currency pair is being accumulated (bought) or distributed (sold). This insight is invaluable for forex market analysis, as it offers a deeper understanding of market sentiments and potential reversals. How It Works in the Forex Market In the context of forex trading, the accumulation distribution indicator works by calculating a money flow multiplier and multiplying it with the corresponding period’s volume. This creates a cumulative total that helps me detect bullish or bearish signals. For instance, a rising indicator line suggests accumulation, indicating potential upward movement, while a falling line implies distribution and potential downward movement. This functionality is at the heart of strategic trading, enabling more accurate predictions of currency pair movements. Importance for Traders Understanding the importance of the accumulation distribution indicator is essential for any trader looking to succeed in forex trading. By leveraging this tool, I gain significant advantages, such as: Enhanced forecasting: It provides early signals of market trends and potential reversals. Improved decision-making: Incorporating this indicator in my forex market analysis helps in making data-driven decisions. Optimised trading strategies: With clearer insights into market movements, I can refine my strategic trading approaches for better profitability. In summary, mastering the accumulation distribution indicator and its application within the forex market is indispensable for crafting effective trading strategies and achieving long-term success. The Mechanism of Accumulation Phase The accumulation phase is a pivotal moment in forex trading. It’s when smart money starts buying assets slowly, stabilising prices before a big move. Grasping this phase helps traders make informed decisions and seize market opportunities. Identifying its key traits is crucial for spotting potential profit points. Characteristics of the Accumulation Phase In the accumulation phase, forex charts show distinct traits. Prices stay within a narrow range, showing a balance between supply and demand. Volume increases as big players buy in, but prices don’t rise much. This phase is also marked by lower volatility and a gradual upward trend in trading signals. Support levels form and hold strong, adding to market stability. These characteristics are key to understanding this phase. How to Identify Accumulation in Forex Charts To spot the accumulation phase, you need to look for specific patterns and signals through market analysis. Watch for horizontal or slightly rising price trends with increasing volume. This shows institutional buyers are entering the market. Technical indicators like On-Balance Volume (OBV) or the Accumulation/Distribution Line can confirm these patterns. Identifying consistent support levels across different timeframes is also crucial. Recognising these signals helps you plan your trades effectively, aligning with the market’s momentum shown in forex charts. Recognising the Distribution Phase in Forex Trading Identifying the Distribution Phase in forex trading is crucial for traders aiming to enhance their market positioning. This phase requires informed decisions based on precise trading signals. The shift from accumulation to distribution is key to grasp and spot. Fundamentals of Distribution The distribution phase comes after accumulation and is marked by a period where key players sell financial instruments like currencies. It’s vital to understand that during distribution, prices often consolidate at high levels before any significant decline. This knowledge helps adjust forex strategies efficiently, preventing losses from misjudging this phase as continued accumulation. Signals Indicating Distribution Phase Spotting the distribution phase demands careful observation of certain trading signals. Look for: Volume Analysis: High trading volume during price highs signals distribution. Price Action: Repeated price peaks and resistance levels hint at a distribution phase. Integrating these elements into your forex strategies enhances market positioning. They offer insights into future price movements, guiding when to adjust positions or exit trades. Signal Description High Volume Selling pressure is indicated by increased volume at higher prices. Resistance Levels Price struggling to break past a certain level multiple times. Explosive Movements: When and Why They Happen In the dynamic realm of forex trading, explosive movements are significant events that can transform trading landscapes almost instantaneously. Understanding these drastic shifts is crucial, particularly given the inherent market volatility and evolving financial trends. Let’s explore the key triggers that precipitate these explosive movements and delve into their analysis and impact. Triggers of Explosive Movements Several factors can trigger explosive movements in forex trading. Major geopolitical events, such as elections, referendums, or political instability, are primary catalysts. These events can cause sudden shifts in currency valuations. Unexpected economic announcements, such as changes in interest rates or unemployment rates, also play a significant role. These announcements can either strengthen or weaken a currency dramatically. Geopolitical Events: Political uncertainty or major changes in leadership can destabilise a country’s currency. Economic Indicators: Announcements related to GDP, inflation, or employment can have immediate impacts on
Exploiting 50% Retracement Play For Swing Trading Crypto Traders
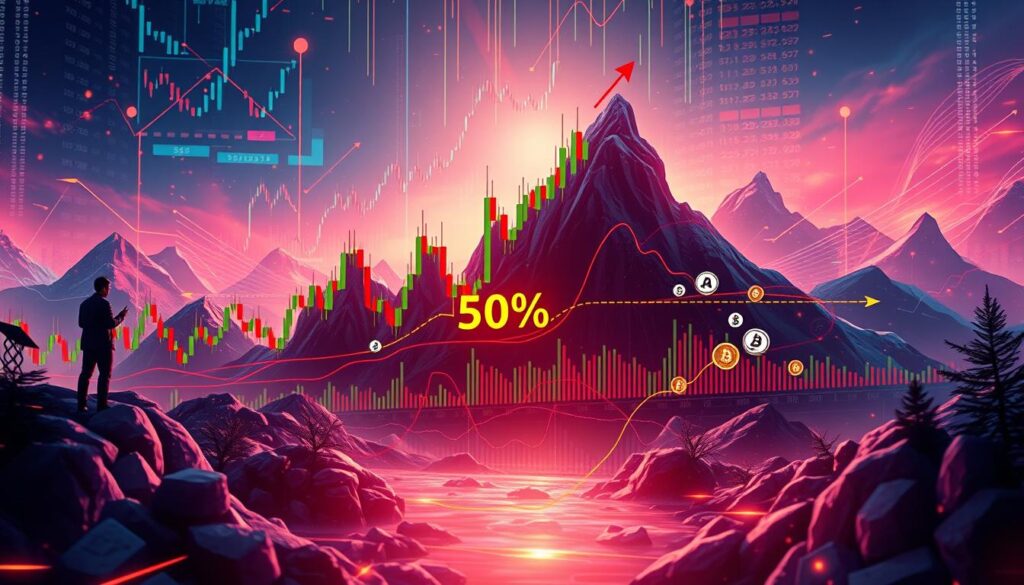
In the realm of swing trading crypto, the 50% Retracement Play Trading Strategy stands out. It’s a go-to for many due to its effectiveness. The strategy leverages market retracement, a key concept in technical analysis. It helps identify potential price reversals, crucial in the volatile crypto markets. This article will explore the 50% retracement play in depth. We’ll cover its fundamental principles and how to blend it with other strategies. By the end, you’ll have the knowledge to use this technique to your advantage. Key Takeaways The 50% retracement play is a crucial technique in swing trading crypto. This strategy focuses on identifying potential market reversals through retracement levels. Understanding market volatility and applying reliable strategies is vital for crypto traders. We’ll cover everything from fundamental principles to advanced technical analysis. Integrating the 50% retracement play with other strategies enhances trading success. Introduction to the 50% Retracement Play Trading Strategy The 50% retracement play has become a key player in crypto swing trading. It focuses on price movements after a security, like a cryptocurrency, drops to 50% of its previous rise or fall. This strategy combines technical analysis with market retracement patterns. It helps traders make informed decisions. In the stock market, retracement has always been crucial. The 50% retracement level has a significant psychological impact. With cryptocurrencies, this strategy has adapted well to their volatility and unique dynamics. Crypto traders use it to spot swing trading opportunities, making it essential in their toolkit. Using the 50% retracement play in a trade strategy helps traders navigate the crypto market’s challenges. It works best with assets like Bitcoin and Ethereum, where retracement patterns are clear. This strategy blends historical trading wisdom with modern technology, offering a strong path to profitable trading. Why the 50% Retracement Play is Effective in Swing Trading The 50% Retracement Play is a standout effective trade strategy in swing trading. It uses technical analysis to tap into trader psychology, leading to consistent success. Markets naturally fluctuate, and a 50% pullback often signals the end of a correction. This is when the original trend is likely to resume. Many market scenarios have proven the 50% Retracement Play’s effectiveness. For example, during major corrections like the dot-com crash or the 2008 financial crisis, it helped traders find better entry points. These successful trades show its reliability and ongoing relevance. The strategy’s adaptability further solidifies its position as an effective trade strategy. It works in both bullish and bearish markets, adapting to different environments. This makes it a straightforward way for traders to use technical analysis effectively. Here’s a look at past market scenarios where the 50% Retracement Play excelled: Market Event Application of 50% Retracement Play Outcome Dot-Com Crash (2000-2002) Identifying mid-correction entry points Profitable trades post-recovery 2008 Financial Crisis Utilising retracements during fluctuating phases Accurate forecasting of trend continuations Bitcoin Bull Market (2017) Spotting corrections in a rapid rise Protected gains through timely exits The evidence is clear: using a 50% pullback with technical analysis is a effective trade strategy in swing trading. Its consistent success across various scenarios and timeframes showcases its strength and practicality. It’s a crucial tool for traders globally. The Fundamental Principles of Market Retracement Grasping market retracement is vital for traders aiming to navigate the complex world of trading trends and the stock market. It’s about the temporary reversal in a stock’s price, moving against the current trend. This concept is key for traders to make better decisions and predict future price movements. Understanding Market Retracement Market retracement marks areas of support or resistance where prices pause or reverse. It’s not a complete turnaround but a slight pull-back. After this, the original trend usually resumes. This understanding is crucial for traders to anticipate price shifts. Key Indicators for Retracement Spotting retracement levels requires key indicators like Fibonacci Retracement, Moving Averages, and Bollinger Bands. These tools are vital for spotting potential retracement areas. By focusing on these indicators, traders can better utilise market retracement within the context of trading trends. Fibonacci Retracement: Uses Fibonacci ratios to find key levels. Moving Averages: Smooths out price data to show trend direction. Bollinger Bands: Uses standard deviations to measure volatility. Why 50% is a Crucial Level The 50% retracement level is significant due to its psychological impact in stock market trading. It’s linked to the golden ratio, marking a point where prices have corrected enough to continue their trend. Traders often watch this level to plan their entry and exit strategies. Technical Analysis for the 50% Retracement Play Exploring technical analysis for the 50% Retracement Play reveals the importance of chart patterns and trading trends. By examining past price movements, we can spot potential reversal points. This helps us craft strategies to increase gains and cut down risks. Identifying specific chart patterns is key to this strategy. Triangles, flags, and head-and-shoulders patterns often signal a 50% retracement. This allows us to predict market movements with more accuracy. Integrating technical indicators is crucial for our analysis. The Moving Average Convergence Divergence (MACD), Relative Strength Index (RSI), and Bollinger Bands help confirm our insights. These tools refine our entry and exit points, reducing false signals. Psychological barriers also play a significant role in technical analysis. The 50% retracement level often acts as a support or resistance zone. Recognising these levels can significantly impact our trading decisions. Combining technical analysis with broader market data is a powerful strategy. Here are some tips to enhance our approach: Cross-referencing historical data with current chart patterns Utilising multiple time frames to confirm trends Incorporating trending indicators for more accurate predictions Below is a comparative overview of significant indicators: Indicator Purpose Strength MACD Determines market momentum Identifies trend reversals RSI Measures speed and change of price movements Prevents overbought or oversold trades Bollinger Bands Assesses market volatility Adaptive to market conditions Fibonacci Retracement Identifies potential reversal levels Enhanced accuracy with 50% play By adhering to these guidelines and grasping the fundamentals of technical analysis, we can enhance our trading accuracy with the 50%
Exploiting 50% Retracement Play For Swing Trading Crypto Traders

Discover the art of the 50% Retracement Play Trading Strategy, a must-know tactic for savvy crypto swing traders aiming for success.
Conquering Hourly Shifts via 3-Line Strike Strategy For Scalping Forex Traders
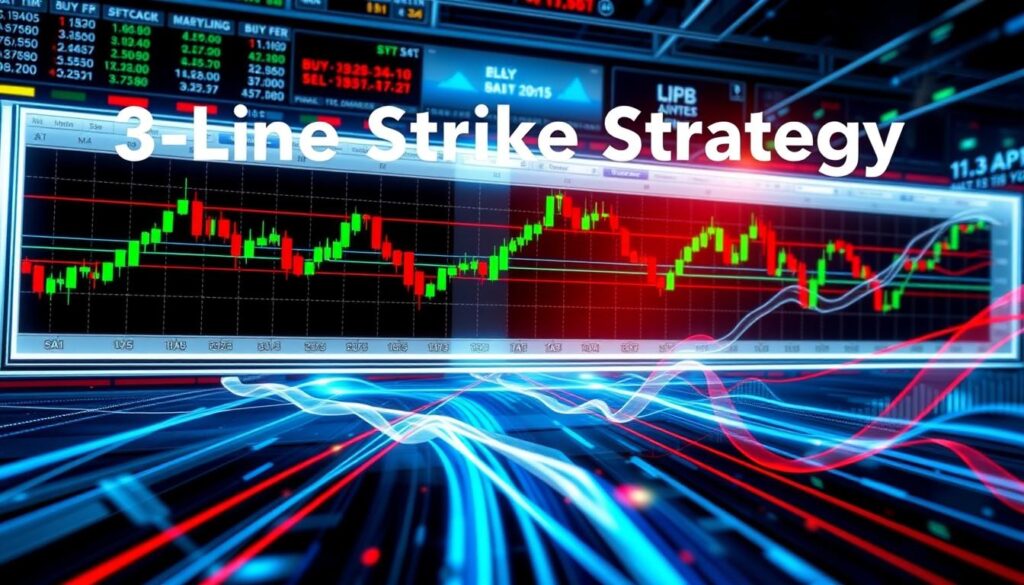
In the fast world of Forex trading, I’ve found that a good scalping strategy can lead to steady profits. The 3-Line Strike Strategy is a key tool for making the most of quick market changes. This article will explain the basics of this strategy and offer tips to help traders do better in the forex market. Key Takeaways Understanding core principles such as economic indicators is vital for effective trading. Scalping techniques for forex trading focus on capitalising on short-term price movements. The 3-Line Strike Strategy combines specific indicators to improve trade success rates. Risk management practices are crucial to withstand unexpected market fluctuations. Customisation of trading strategies based on personal trading styles enhances performance. Understanding the Basics of Forex Trading Forex trading is about exchanging currencies in the fast-paced forex market. Knowing the Forex trading basics is key for new traders. It involves buying and selling currency pairs, where you buy one currency and sell another at the same time. The base and quote currencies play big roles in trading. They affect your decisions and strategies. The forex market never stops, driven by economic factors and trader feelings. Each currency pair has its own Forex market dynamics. These are influenced by world events, economic data, and market guesses. Traders pick currency pairs to make money from rate changes. They make smart choices based on market trends and patterns. Choosing the right currency pairs is crucial for success. Pairs like EUR/USD, USD/JPY, and GBP/USD are popular. They offer different levels of liquidity and volatility. Knowing these aspects helps in a strategic trading approach. It’s the first step towards more advanced techniques, like scalping. What is Scalping in Forex Trading? Scalping in forex is a short-term trading strategy. It aims to make money from small price changes. Scalpers make many trades in a day, hoping for quick profits. This method needs a deep understanding of the market and quick decision-making. Each trade is done in seconds, making precise analysis crucial. Learning about forex scalping techniques is key. These methods include using different tools and indicators to spot opportunities fast. Traders watch market trends and signals closely, using various analysis methods to make the most of small changes. My experience shows that successful scalping in forex depends on knowing when to enter and exit trades. It requires a fast response to make the most of small profits. Traders need to stay focused and patient, as many small profits can add up to big gains. In conclusion, scalping is an exciting but challenging part of forex trading. It requires quick thinking and refined trading skills. Spending time to learn these skills can lead to better trading experiences in the fast-paced forex world. Key Components of a Successful Forex Scalping Strategy In Forex trading, knowing the key parts of a successful scalping strategy is vital. By aiming for many small wins, I avoid the big losses that often come with chasing large gains. Scalpers make lots of trades daily, sometimes up to 200, which helps in achieving Forex trading success. Effective use of indicators is a crucial part of scalping. The stochastic oscillator helps spot trends and reversals. Moving averages, both short and long-term, help in understanding trends. The Parabolic SAR indicator shows when to enter or exit trades by placing dots above or below price bars. Managing risk is also key in scalping. Each trade needs quick and smart decisions. It’s important to avoid chasing trades and always use stop-loss orders to prevent big losses. Studies show that more frequent trading can lead to quick losses, so patience and discipline are essential. Setting realistic profit targets is also important. In scalping, even a 1:1 return means one loss can wipe out many wins. The one-minute scalping strategy uses the Exponential Moving Average and stochastic oscillator for quick trades. This focus on small gains helps manage risks in volatile markets. Introduction to the 3-Line Strike Strategy For Scalping Forex Traders The 3-Line Strike Strategy is key for forex scalping. It looks for a pattern of four candlesticks. Three show a trend, and the fourth changes direction. This strategy finds trading chances, whether the market is going up or down. Defining the 3-Line Strike Strategy This strategy spots when trends might keep going or change. It works in both rising and falling markets. The bearish version hints at a downtrend continuing or reversing. The bullish version signals an uptrend might keep going or reverse. Traders often use extra tools like moving averages and the Relative Strength Index (RSI) to improve results. The Importance of Timing Timing is everything in forex trading with the 3-Line Strike Strategy. Knowing the trend and the next candle’s move helps find the best entry points. Setting stop-loss levels and profit targets is key to managing risk. Understanding market psychology, like fear and greed, helps traders make better decisions. This adds to the strategy’s timing importance. How to Identify Ideal Trading Conditions Finding the right trading conditions is key for scalpers looking to make the most money. It’s all about understanding the market well. This means knowing how liquidity and volatility work. For scalping, a good trading environment has high liquidity. This means tighter spreads, which cut down on costs. I look for times when big markets overlap to trade. This is when the market is busiest and prices move fast. Volatility is also important. It offers many chances for scalping, especially around big news. I watch for things like interest rate changes or job numbers. These events can cause big price swings. High liquidity periods, preferably during key market overlaps. Tight bid-ask spreads for effective trade execution. Heightened volatility associated with significant economic events. Awareness of market sentiment, ensuring that my analysis aligns with prevailing trends. By knowing and using these conditions, I can do well as a forex scalper. The right mix of liquidity, volatility, and knowing what’s happening outside the market helps me make more money. Condition Importance Best Practices High Liquidity Tighter spreads enhance profitability Engage
Decoding 15-Minute Charts with 5-0 Trading Pattern For Intraday Stock Traders
In the fast world of day trading, knowing 15-minute charts is key. They help traders like me spot short-term trends. This lets us make quick and smart decisions about when to buy or sell. The 5-0 Trading Pattern For Intraday Stock Traders is a clever strategy. It makes the stock market’s complex world easier to understand. By studying these patterns, I can improve my trading plans and do better overall. Since about 60% of currency trades happen through bank talks, good chart analysis is very important. It can really change how well a trade does. Using 15-minute charts helps me understand the stock market better. It also helps me stay ready for the market’s ups and downs. In the next parts, I’ll dive into the 5-0 trading pattern’s main points and how it helps me in trading. Key Takeaways 15-minute charts provide a clear view of short-term market movements. The 5-0 trading pattern helps in identifying key trading opportunities. Effective chart analysis is essential for developing successful intraday trading strategies. Understanding market volatility aids in making timely trading decisions. Automated trading systems play a significant role in enhancing trading efficiency. Introduction to 15-Minute Charts As an intraday trader, I find 15-Minute Charts very useful. They give a detailed look at price changes during the day. This helps me quickly respond to market changes. These charts are great for spotting short-term trends. They help me make better trading plans. By looking at shorter periods, I can find the best times to buy or sell. 15-Minute Charts show important price levels. Patterns like the head and shoulders can help predict market changes. Using these patterns with Technical Analysis Tools helps me make smarter trades. These charts also show trading volume trends. This is key to understanding market liquidity. It helps me find the best trading chances. Combining 15-Minute Charts with good trading strategies has changed my approach. It has improved my trading results. The Importance of Chart Analysis in Intraday Trading Chart analysis is key for intraday trading success. It gives traders the insights needed to understand the stock market. By using different analytical methods, I can spot trading chances effectively. Patterns like triangles and flags often show where the market is going. But, these patterns lose their power when everyone knows them. False breakouts, especially with head-and-shoulders patterns, can mislead traders. Knowing this helps me avoid these traps. Using charts like the Gartley pattern and Fibonacci adds depth to my analysis. This helps me understand when trends might change or continue. For example, the crown pattern helps me spot market turns, making my trading decisions more reliable. The Fibonacci series is great for making price predictions. It helps me plan my market moves better. Adding volume analysis to my chart study makes my findings more solid. It shows me if a pattern is real or not. Learning from common mistakes makes my trading smarter. I avoid overlooking the big picture or ignoring volume. Good risk management is crucial when using different chart patterns. It helps me limit losses and grab good opportunities. Chart Pattern Type Characteristics Usage in Trading Head-and-Shoulders Reversal Signifies a trend reversal; subject to false breakouts Used to predict downward movements Gartley Harmonic Fibonacci relationships applied to price swings Identifies potential price retracement levels Crown Reversal Utilises Fibonacci to identify turning points Enhances odds of successfully trading Fibonacci Extensions Predictive Ratios used for anticipating price targets Guides strategic trading decisions Understanding Market Volatility Market volatility is how fast the price of things like stocks goes up or down. It’s key for those who trade during the day. Things like economic news and market trends can cause these changes. Good stock trading tips say to watch money flow. If money flow is up, prices might go up too. But if it’s down, prices could fall. For example, Day One saw a lot of money flow, but Day Two didn’t. How volatile the market is affects trading. Tools like the Chaikin money flow oscillator help. They show when things are overbought or oversold. This helps traders know what to do next. Harmonic patterns, like those by M. Gartley, help traders. They use Fibonacci numbers to make smart choices. These patterns are useful for dealing with market ups and downs. But, harmonic patterns can be tricky to learn. Traders need to be patient. Yet, they can offer valuable insights. Some even use computers to find these patterns, making trading easier. Decoding the 5-0 Trading Pattern For Intraday Stock Traders The 5-0 Trading Pattern is a key tool for spotting high-probability trades. It captures market movements and fits well with my intraday trading strategies. Knowing this pattern is essential for making timely decisions that boost trading success. Overview of the 5-0 Trading Pattern The 5-0 Trading Pattern is known for its clear structure, appearing after big price moves. It has five key price points that show potential reversals. This helps traders predict future price actions and make better decisions. Intraday traders use this pattern to find opportunities in market volatility. Key Characteristics of the 5-0 Trading Pattern The 5-0 Trading Pattern has unique features that make it valuable. These include: Price Point Identification: The pattern has specific levels for potential reversals, marking entry and exit points. Volume Analysis: Watching volume during the pattern’s formation helps confirm trades, showing market sentiment. Timeframe Flexibility: While used in 15-minute charts, its principles work across different timeframes for detailed analysis. Market Context: Knowing the broader market helps validate the 5-0 pattern, guiding my trading strategies. Studies on liquidity support the 5-0 Trading Pattern’s reliability. This gives me confidence in navigating intraday trading’s complexities. Characteristic Description Structure Consists of five distinct price points indicating potential reversals. Volume High volume at specific points offers confirmation of market moves. Timeframe Effective in 15-minute charts but applicable across different timeframes. Market Context Understanding overall market conditions is crucial for accurate analysis. Technical Analysis Tools for Day Traders As a day trader, I find Technical Analysis Tools crucial for making
